|
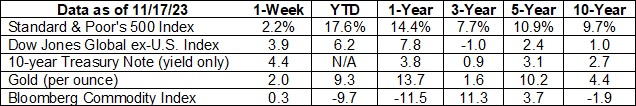
S&P 500, Dow Jones Global ex-US, Gold, Bloomberg Commodity Index returns exclude reinvested dividends (gold does not pay a dividend) and the three-, five-, and 10-year returns are annualized; and the 10-year Treasury Note is simply the yield at the close of the day on each of the historical time periods.
Sources: Yahoo! Finance; MarketWatch; djindexes.com; U.S. Treasury; London Bullion Market Association.
Past performance is no guarantee of future results. Indices are unmanaged and cannot be invested into directly. N/A means not applicable.
WHAT IS THE LONG-TERM AVERAGE ANNUAL RETURN FOR U.S. STOCKS? Theodore Roosevelt is credited with saying, “The more you know about the past, the better prepared you are for the future.” That’s often true when it comes to investing. Investors who have a longer-term perspective on financial markets tend to be less likely to make impulsive decisions that are driven by short-term market volatility and could negatively affect longer-term performance.
Here’s an interesting piece of investment trivia from the Credit Suisse Global Investment Returns Yearbook 2023 (2023 Yearbook).
· In 1899, the United Kingdom’s stock market was the largest in the world.* It comprised about 24 percent of world capitalization. The next largest markets were the United States (15 percent), Germany (13 percent), France (11 percent), Russia (6 percent), and Austria (5 percent).
· By 2023, the United States boasted the world’s largest stock market with about 58 percent of world capitalization. The next largest markets were Japan (6 percent), the U.K. (4 percent), China (4 percent), France (3 percent), and Canada (3 percent).
Market data is valuable because it can help investors understand what has happened in the past and use the knowledge to set realistic expectations for the future. What is your estimate for the long-term average annual return of U.S. stocks?
The 2023 Yearbook provided us with the data. From 1900 through the end of 2022, the average annual return for U.S. stocks before inflation was 9.5 percent. After adjusting for inflation, U.S. stocks returned about 6.4 percent per year. The inflation-adjusted return for stocks outside the United States was 4.3 percent in U.S.-dollar terms.
Over the same period, from 1900 through 2022, U.S. bonds returned 4.7 percent per year before inflation, on average, and 1.7 percent per year after inflation, on average. Bills, which are very short-term investments, had an average annual return of 3.4 percent before inflation and 0.4 percent after inflation.
Over the long term, “[Stocks] were the best-performing asset class everywhere. Furthermore, bonds outperformed bills in every country except Portugal. This overall pattern, of [stocks] outperforming bonds and bonds beating bills, is what we would expect over the long haul since [stocks] are riskier than bonds, while bonds are riskier than cash,” reported Elroy Dimson, Paul Marsh and Mike Staunton who authored the 2023 Yearbook.
*Size was determined using the free-float market capitalizations of the countries in the FTSE All-World index.
Weekly Focus – Think About It
“Although it's easy to forget sometimes, a share is not a lottery ticket...it's part-ownership of a business.”
—Peter Lynch, asset manager
|