


Contact Us Today!

Market Data Bank
Click image to enlarge
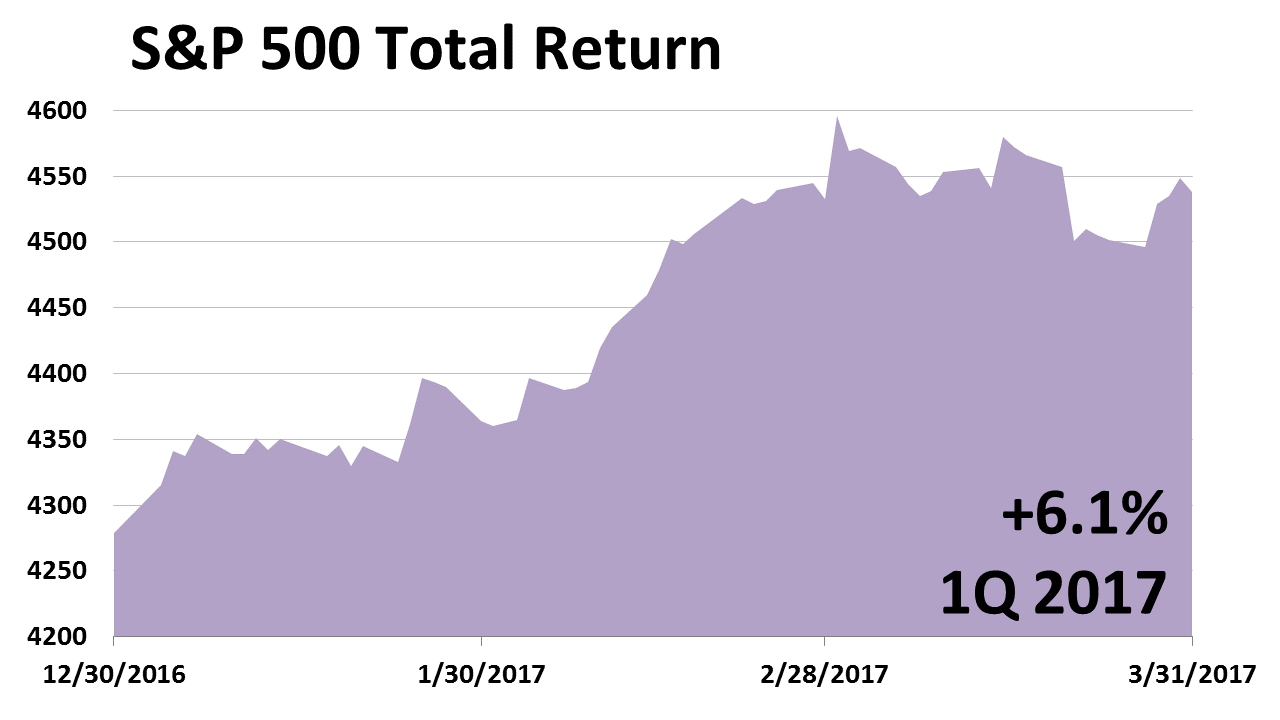
ECONOMY AND STOCKS STRONG
In the first quarter of 2017, stocks posted a total return of 6.1%. That followed a return of 3.8% in the fourth quarter of 2016, 3.9% in the third quarter and 2.5% in the quarter before that. Politics captivated the nation but, at the same time, better than expected economic data has propelled stock prices higher.
Click image to enlarge
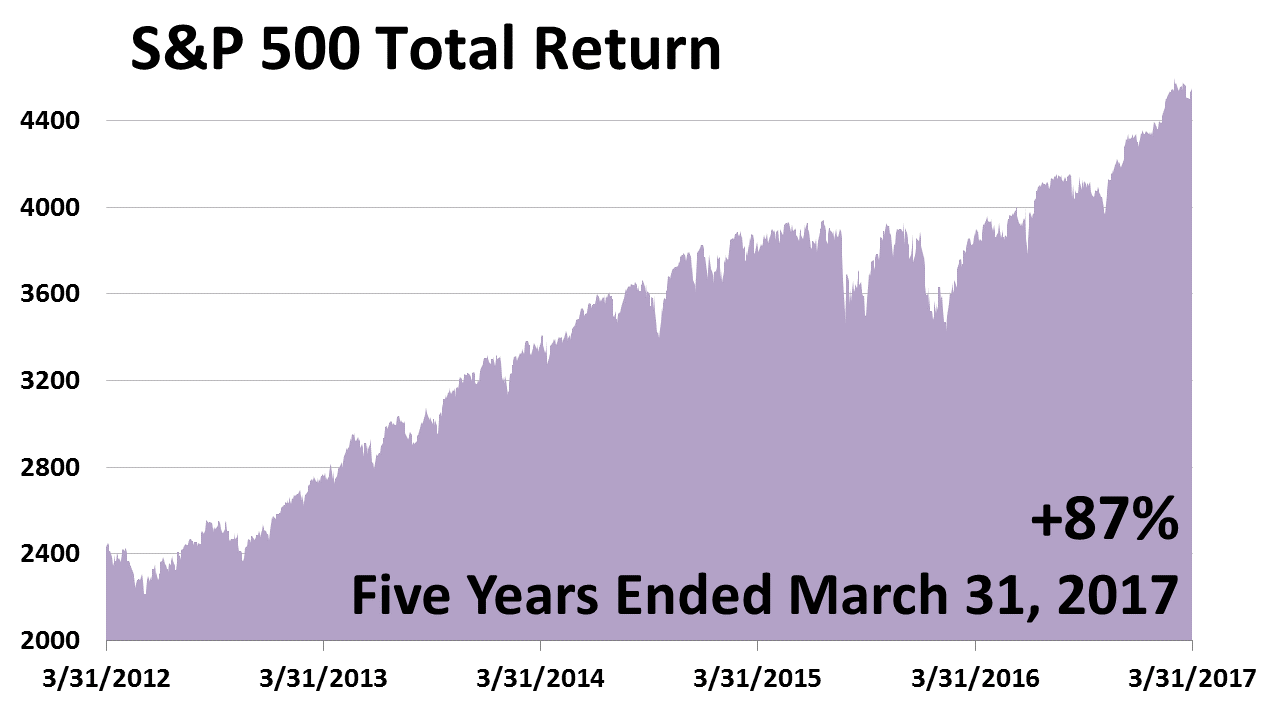
A GREAT FIVE YEARS
Since the near-collapse of the world financial system in 2008, stocks have staged a history-making comeback. In just five years, America’s largest publicly-held companies nearly doubled in value. The chance of a bear market — a drop of at least 20% — increases as the eight-year bull market grows older.
Click image to enlarge
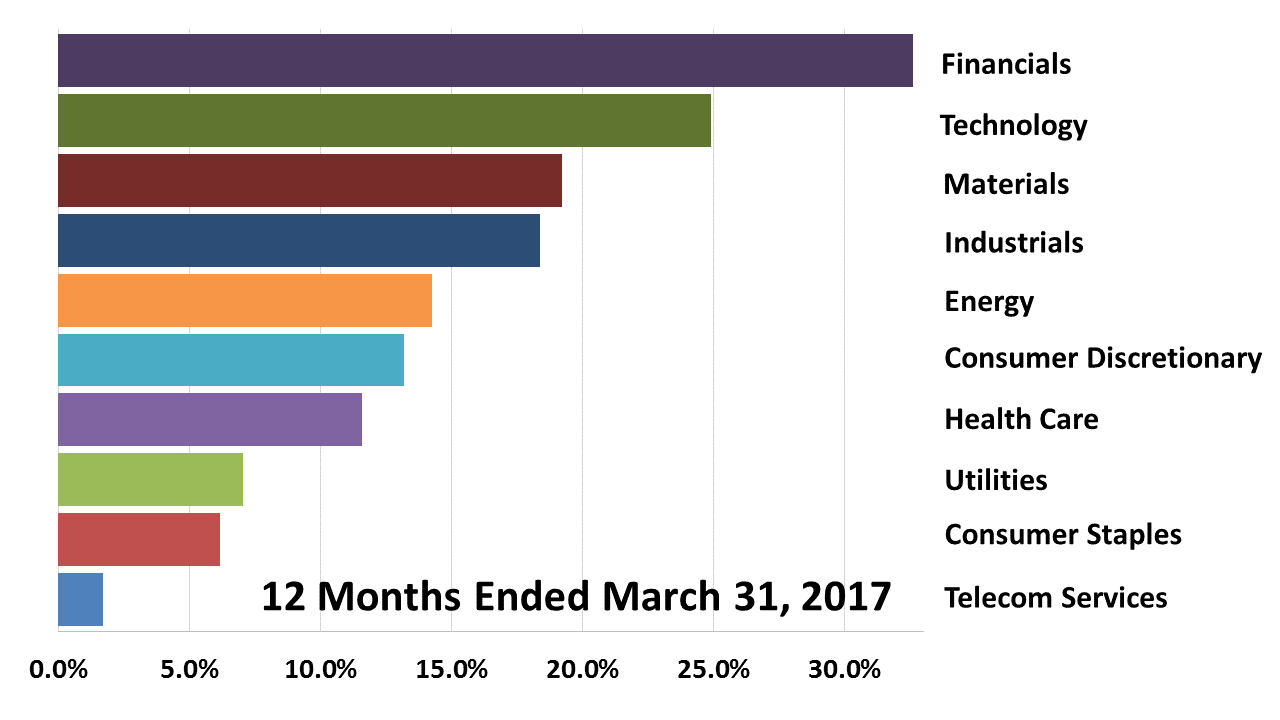
FINANCIAL STOCKS LEAD
For the 12 months ended March 31, 2017, financial stocks were No. 1. Investors welcomed the possibility of rising rates and, post-election, were enthusiastic about a possible rollback of rules imposed on financial companies by the Dodd-Frank Act of 2010.
Click image to enlarge
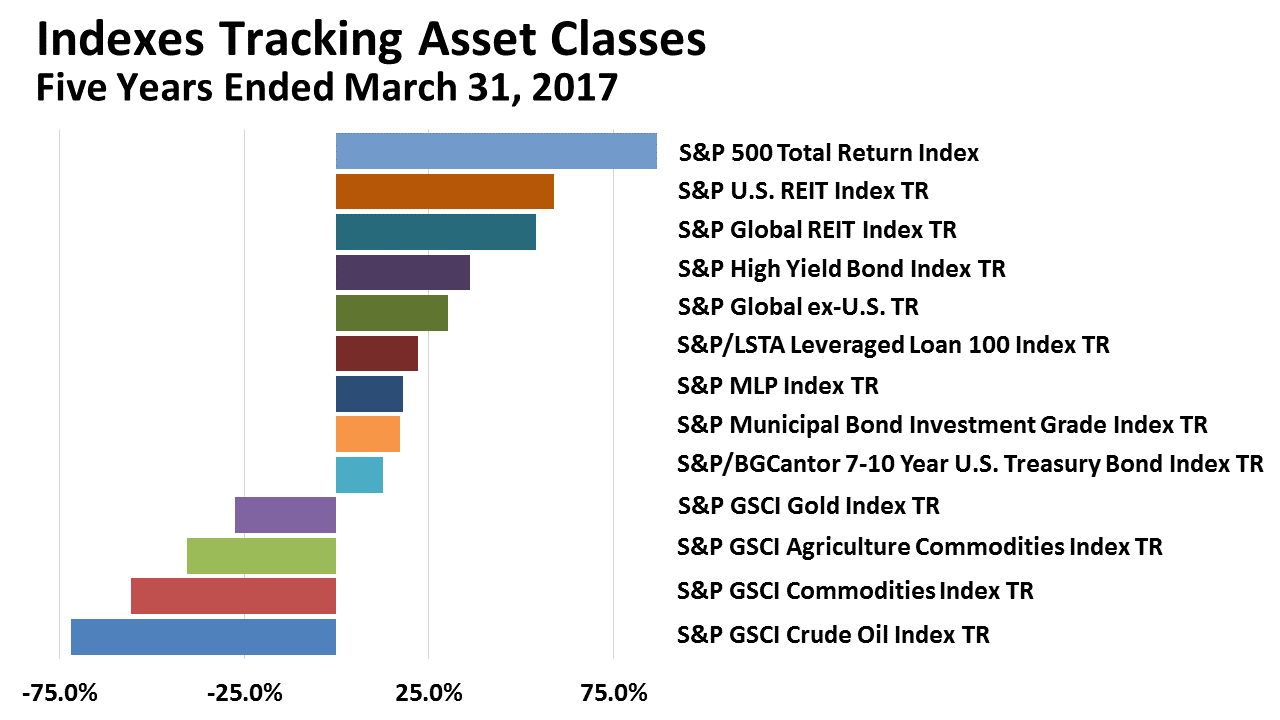
INDEXES TRACKING ASSET CLASSES
For the five years ended March 31, 2017, U.S. large-cap stocks were tops among the broad array of 13 asset classes shown here. Keep in mind, being diversified means your portfolio never will perform as well as the leading asset class, but also means you never will perform as poorly as the worst asset class.

Click image to enlarge
THIS EXPANSION VERSUS OTHERS
At 94 months, the current expansion and bull market are getting on in years, but this compares to the 120-month expansion in the 1990s, the 92-month expansion in the ‘80s, and the 106-month cycle in the ‘60s. This very well could turn out to be the longest expansion since the end of World War II.
Click image to enlarge
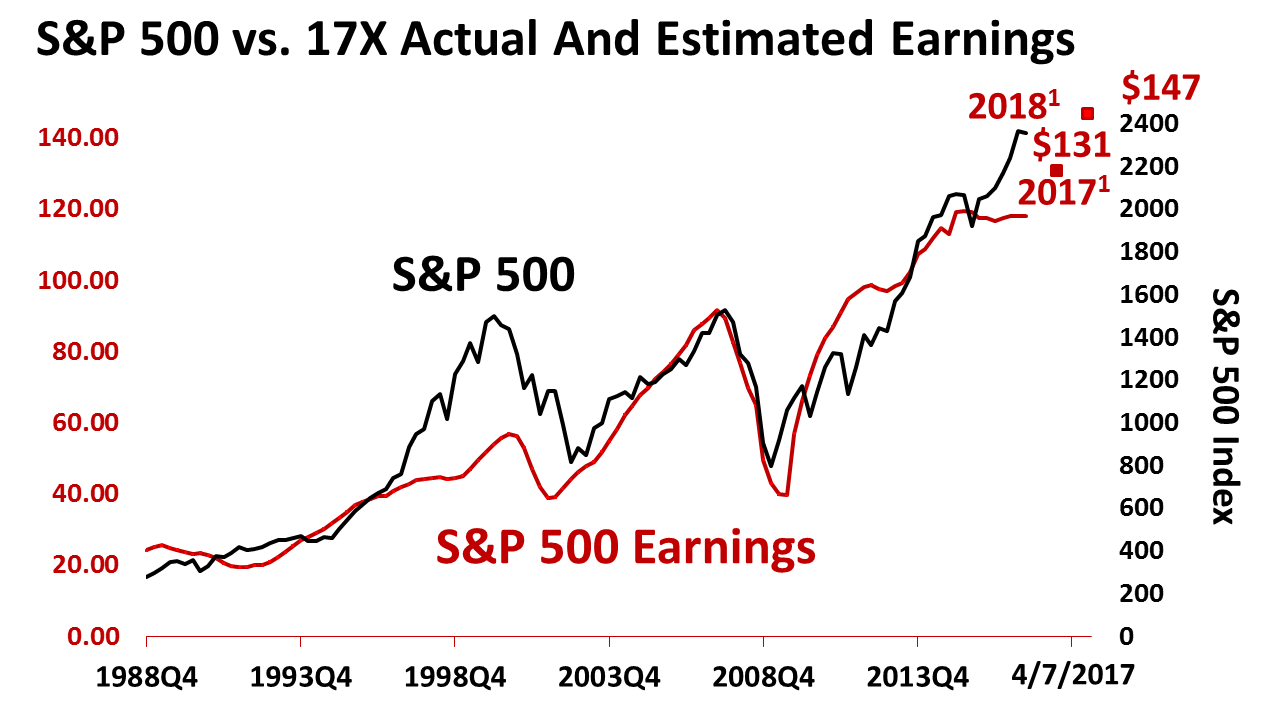
S&P 500 INDEX VS. EARNINGS¥
Estimated earnings on the average share in the S&P 500, as of March 31, 2017, was $130.80 in 2017 and $146.67 in 2018. Stock prices have climbed in tandem with earnings, both actual and projected. Though they are perhaps slightly rich, the valuation on stocks is reasonable and nothing like the bubble of 2000.
Past performance of investments is not a very reliable indicator of future performance. ¥ Indices and ETFs representing asset classes are unmanaged and not recommendations for any specific investment. Foreign investing involves currency and political risk and foreign-country instability. Bonds offer a fixed rate of return while stocks fluctuate. Leading economic indicators from the Conference Board. S&P 500 earnings bottom-up operating earnings per share for 2015 (actual), 2016 (estimated) and 2017 (estimated) as of March 31, 2017: for 2017, $130.80; for 2018, $146.67. Sources: Yardeni Research, Inc. and Thomson Reuters I/B/E/S survey of consensus estimates. Standard and Poor’s for index price data through April 7, 2017; and actual operating earnings data through 2016.
