


Contact Us Today!

Market Data Bank

Click image to enlarge
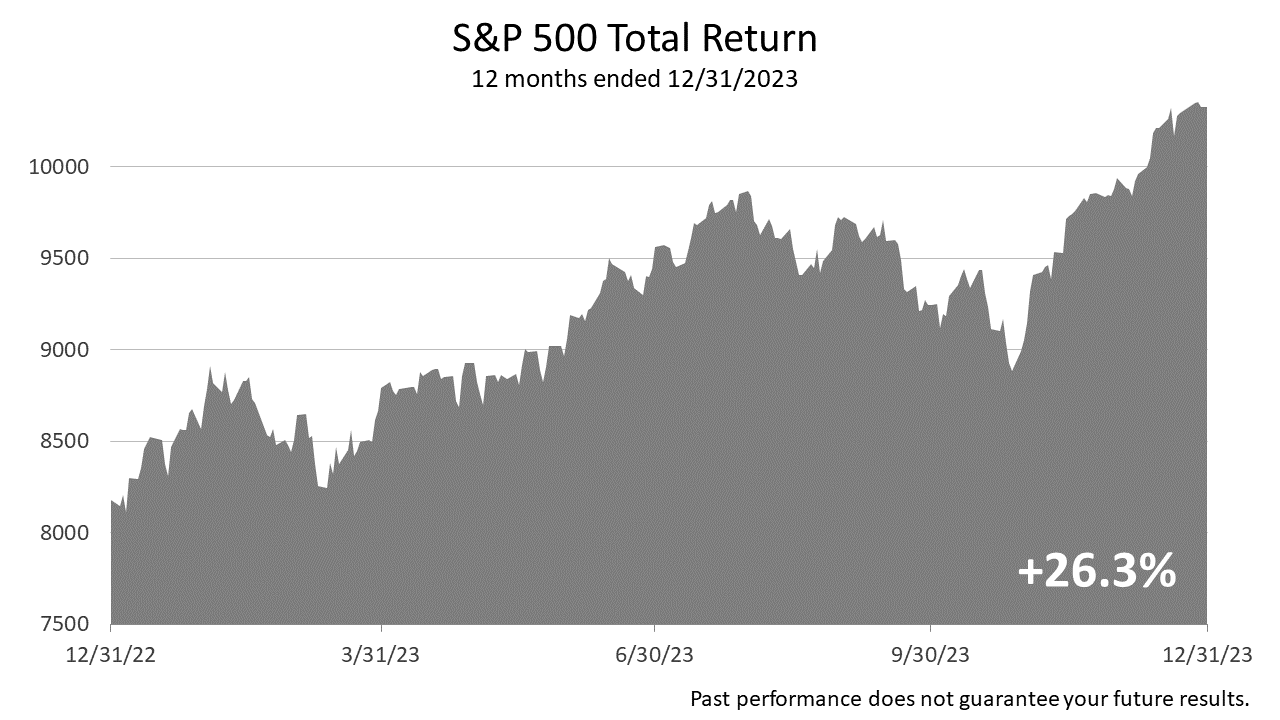
Stocks posted a +11.7% gain in the fourth quarter of 2023, following a -3.3% loss in the third quarter, following a +8.7% gain in the second quarter of 2023, following a +7.5% gain in the first quarter of 2023.
Click image to enlarge

Click image to enlarge
Technology stocks gained 17.2% in last three months of 2023. They were the top-performing industry of the 10 sectors comprising the Standard & Poor’s 500 index.
The “Magnificent Seven,” mega-cap technology giants — Nvidia Corp., Apple Inc., Microsoft Corp., Tesla Inc., Meta Platforms Inc. and Alphabet Inc. — drive the tech industry sector index’s performance.
These seven companies in December 2023 accounted for about 45% of the returns on the stock market, as measured by the S&P 500 index.

Click image to enlarge
Click image to enlarge
Click image to enlarge
2023 will forever be recalled as a year that faked out investors.
At the start of 2023, reliable signs of recession were flashing red, and stock prices were only slightly higher than the post-pandemic bear-market low.
Defying prevailing expectations on Wall Street and Main Street, stock prices closed 2023 with a 12-month gain of 24% — more than twice return averaged for many decades.
Not in recent memory has an outlook so bleak been followed by such strong 12-month stock appreciation and economic growth.
A year ago, a 10-year U.S. Treasury bond yielded less than a three-month Treasury bill. An inverted yield curve — when bond investors are not paid a premium longer-term bonds than 90-day day T bills — is a signal a business slowdown and recession are ahead.
In addition, a year ago, the U.S. Index of Leading Economic Indicators (LEI) was signaling a recession was likely within months.
The LEI is comprised of 10 components and collapsed months ahead of every recession in modern history, except for the pandemic recession. Thus, the LEI is a reliable predictor of a recession. But it was wrong in 2023.
What caused the great fake out of 2023 is debatable, but the best explanation is that investors fell victim to the “money illusion,” a known issue afflicting mass financial psychology.
Financial psychology defines the money illusion as valuing money in nominal terms — paying no attention to after-inflation dollars.
The money illusion infiltrates the American consumer mindset after a period of high inflation.
Consumers and investors soured on the economic outlook because prices on many items had risen sharply for many months at the start of 2023.
Higher prices on groceries wrecked consumers’ outlook post- pandemic, following months of supply-chain problems, massive government stimulus, and higher gasoline prices.
Inflation soared to a 40-year high!
However, the gloomy outlook was inherently flawed.
The money illusion made it easy to overlook the real cost of groceries after-inflation and wage hikes, which is what really mattered.
To be clear, people notice higher prices but gains in wages after inflation often go unrecognized in a period of disinflation.
Immediately after a high-inflation mentality infiltrated the mass financial psyche, it took time for the American consumer’s financial mindset to adjust to a low-inflation period in which consumer buying power is not decimated and showing real growth.
Growth in 2024 is poised to be stronger than expected as the influence of the money illusion continues to be assimilated into the American financial psyche.
Click image to enlarge
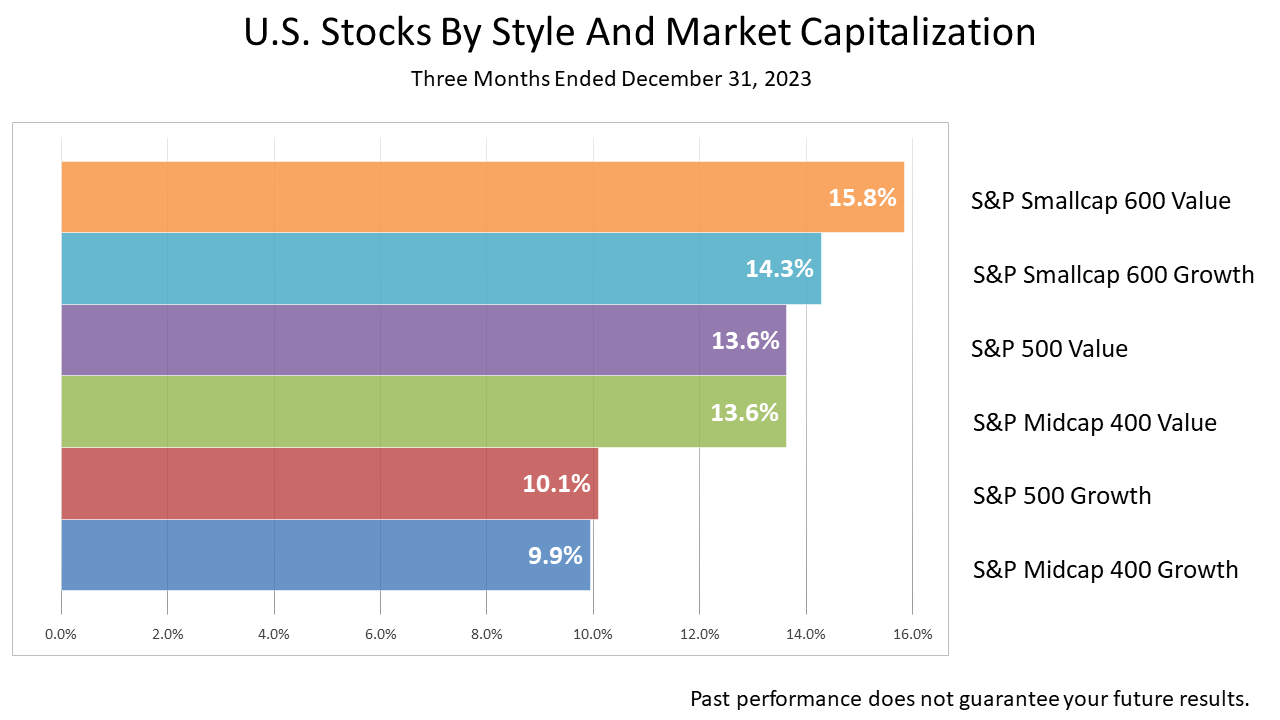
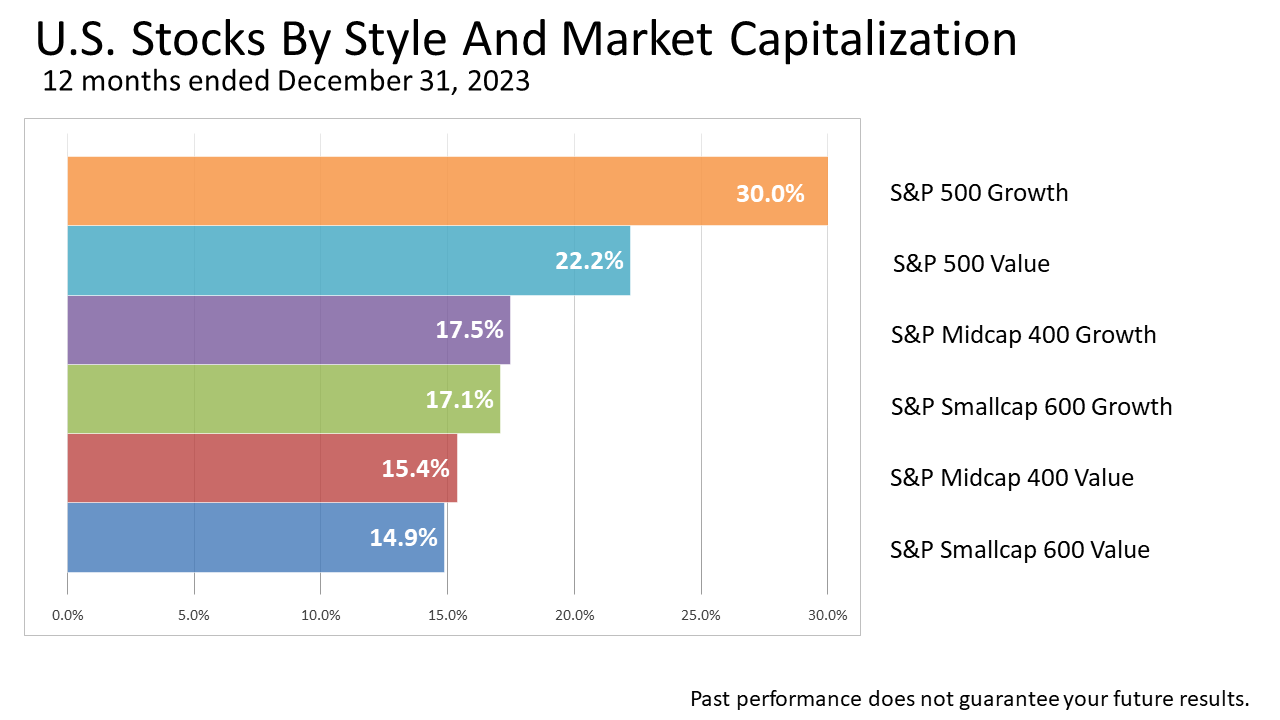
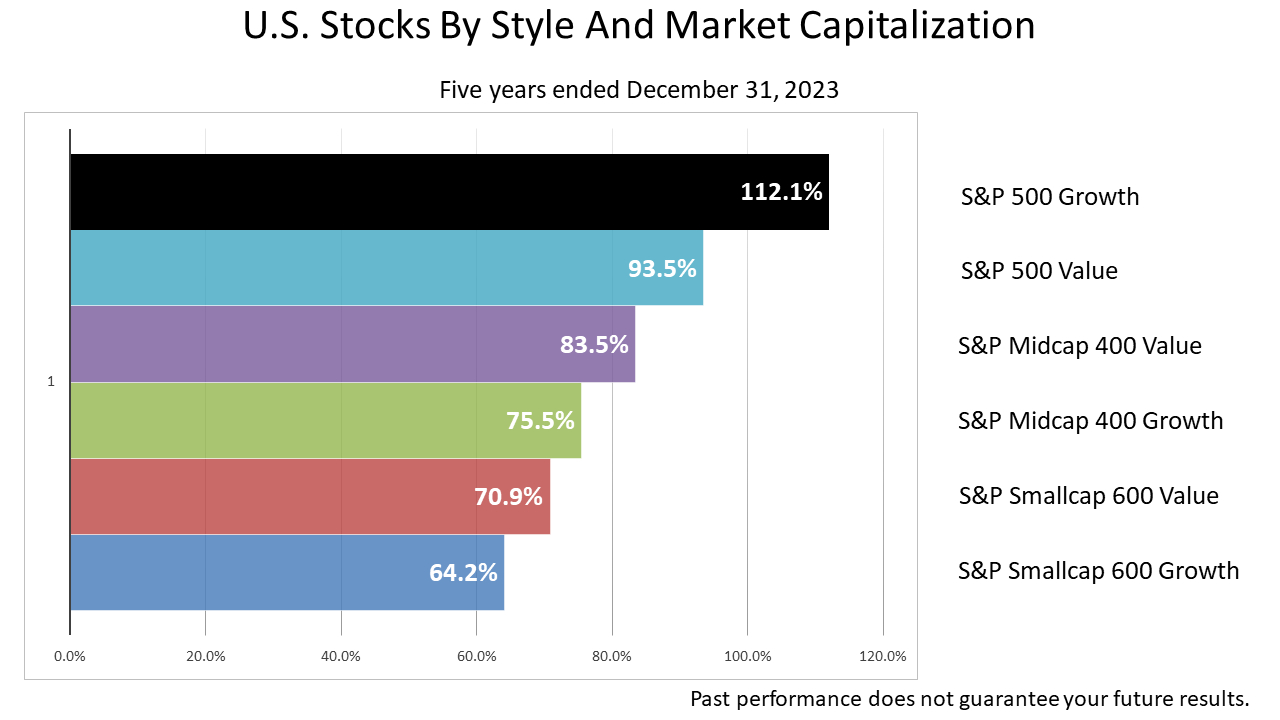
Stronger than expected growth benefited growth company stock prices, while less-dynamic value stocks lagged — across the market capitalization spectrum of small- medium- and large-sized companies in 2023.

Click image to enlarge
The “Magnificent Seven,” mega-cap technology giants — Nvidia Corp., Apple Inc. AAPL, Microsoft Corp., Tesla Inc., Meta Platforms Inc. and Alphabet Inc. drove the Standard & Poor’s 500 stock index performance in 2023. They accounted for nearly 45% of the benchmark’s total capitalization by the end of the year, gaining an astounding 57.8% — five times the average annual return of the broad market, as measured by the S&P 500.
Interest-rate-sensitive utilities were the biggest losers among the 10 sectors comprising the S&P 500.
Energy stocks, which led industry sector performance from 2019 through 2022, have been trailing. This highlights the difficulty of predicting which industry sector, asset class or individual stock will outperform.

Click image to enlarge
We give investment advice predicated on modern portfolio theory.
MPT is a large body of financial knowledge based on academic research done over the last 70 years.
This framework for investing is now taught in the world’s best business schools and embraced by institutional investors.

Click image to enlarge
To reduce the concept down to basics, MPT is a way of limiting the risk of losing money for investments you commit to holding until you die, or for at least a couple of decades.
The world that investments revolve around is always changing, and not enough statistical history exists to make investment predictions with certainty.
MPT is a framework for managing that risk.

Click image to enlarge
MPT is a quantitative framework for investing based on financial, economic, and statistics.
MPT adjusts what’s happened in the past to produce an investment outlook based on economic fundamentals.
MPT does not guarantee success, but its logic is widely embraced by pension funds, other institutional investors and academia.
In addition to classifying investments based on their distinct statistical characteristics, MPT imposes a quantitative discipline for managing assets based on history and fundamental facts about finance.
On top of the statistical knowledge about how assets behave based on MPT, a layer of knowledge of history and experience is added.
That layer is professional judgment, and it’s a distinguishing characteristic of this firm.
Click image to enlarge
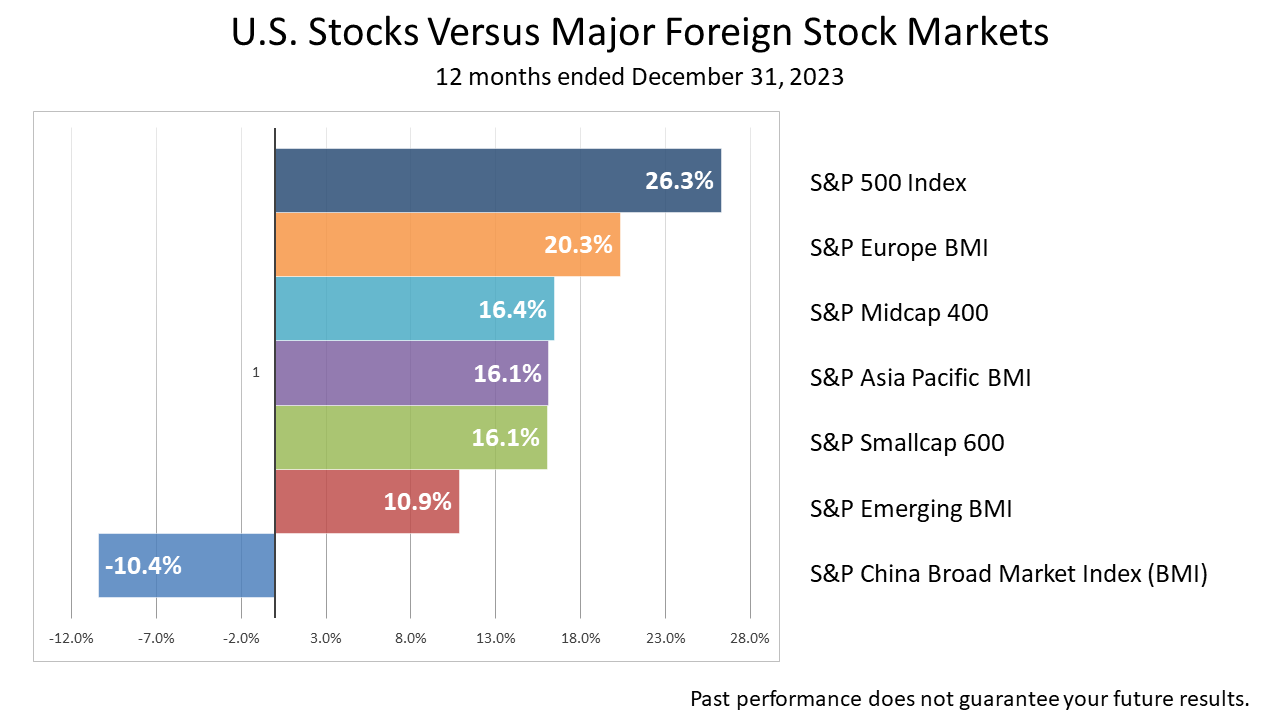
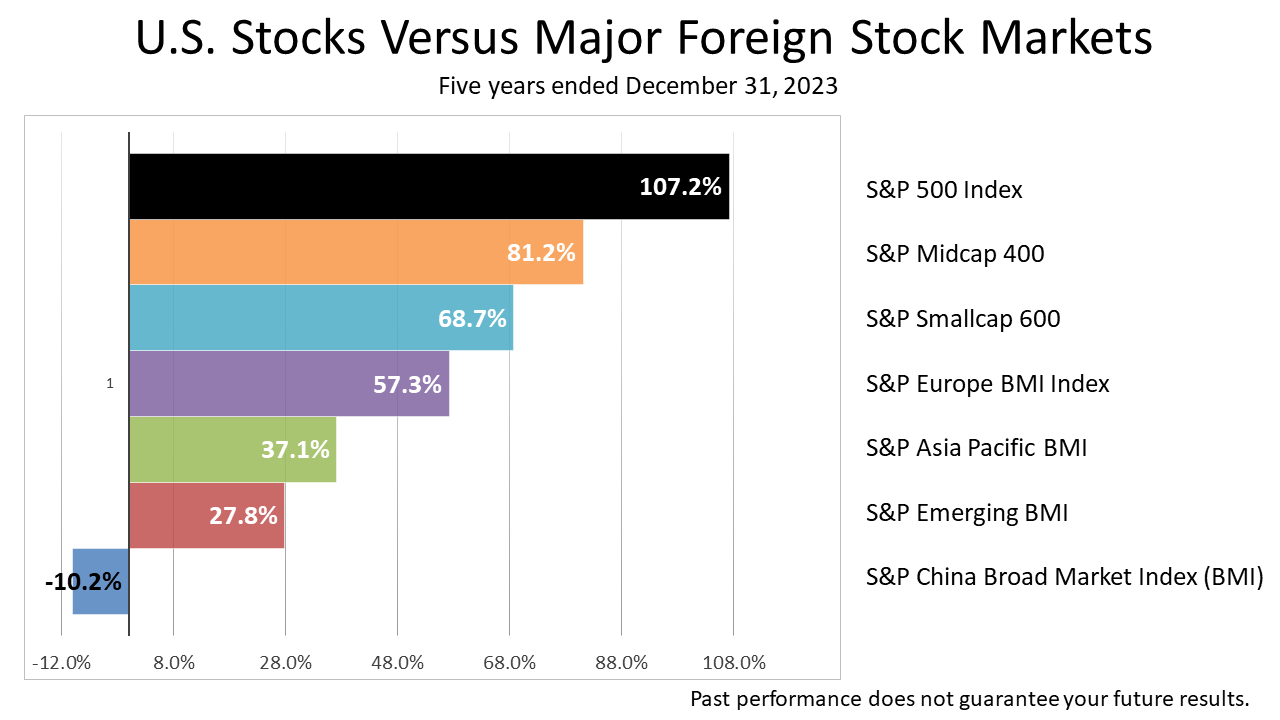
The United States remains the world’s economic leader, as was shown in the 12 months ended December 31, 2023.
Click image to enlarge
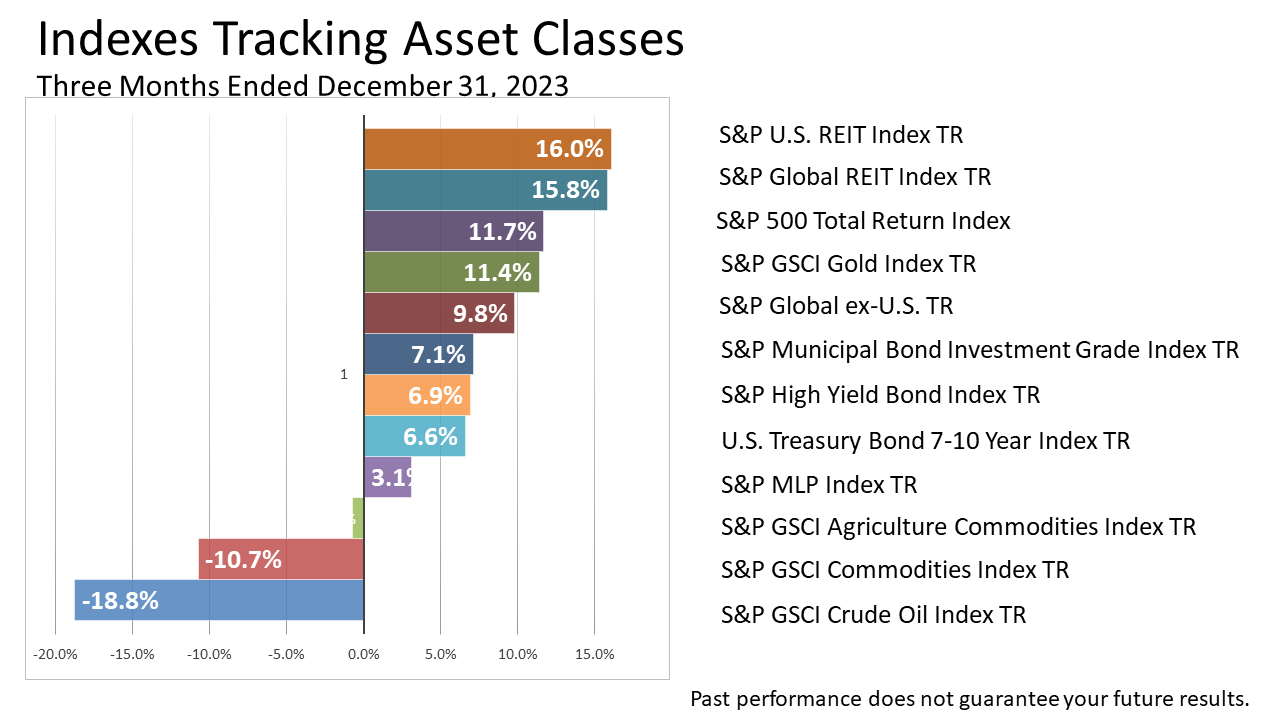
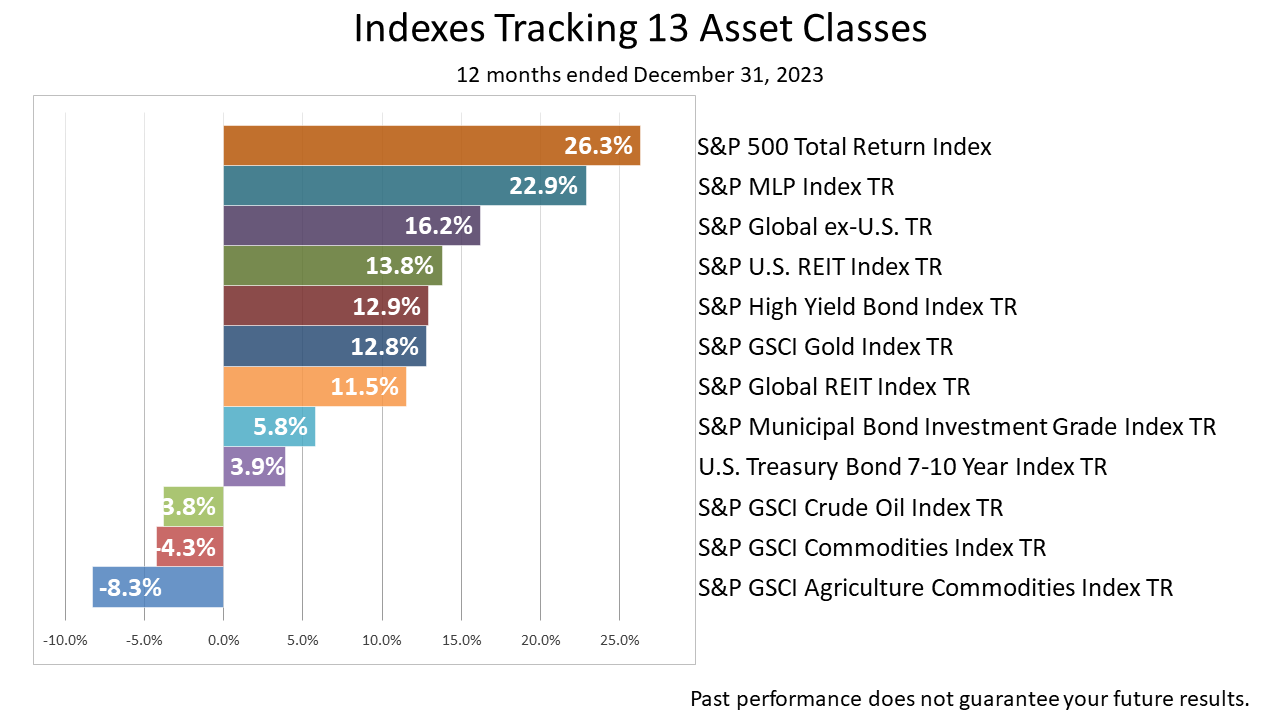
This graphic shows the cumulative return of 13 securities indexes designed to track a wide range of asset classes, including U.S stocks, energy, agriculture, and gold-mining companies as well as other securities indexes designed to mimic the performance of fixed income securities, foreign stocks, and real estate ventures.
Look at the performance of this broad swath of investments, common elements of a diversified portfolio over the 12 months of 2023.
The No. 1 performer was the U.S.
The U.S. has come back stronger than other investments represented in this one-year snapshot.
Click image to enlarge
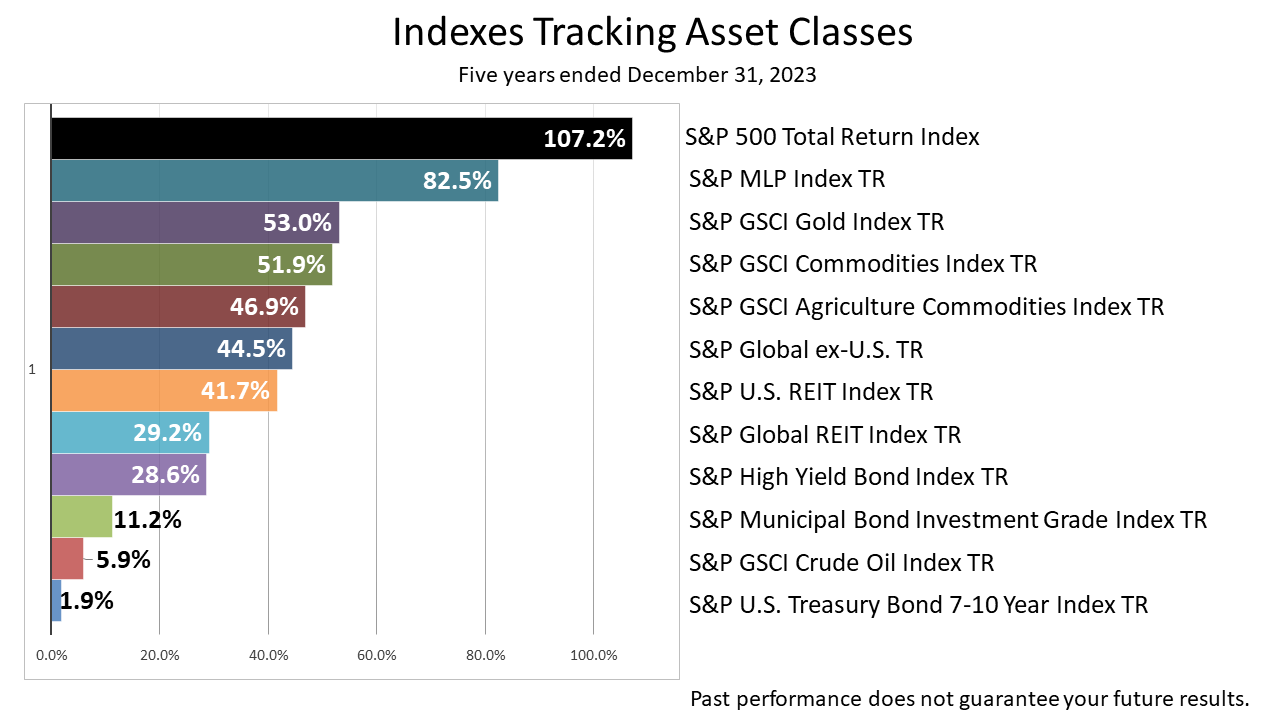
Now look at his graphic showing the cumulative return of 13 securities indexes designed to track the same wide range of 13 different asset classes over FIVE years.
The past five years seemed tumultuous.
This period includes the 15 months before the peak of the boom before the March 2020 pandemic, which resulted in a partial shutdown of the economy. The five-year period also includes the inflation crisis of 2022, the most aggressive interest-rate policy in U.S. history between March 2022 and July 2023, and heightened geopolitical risk posed by authoritarian regimes in China, Russia, Iran, North Korea and their proxies.
The U.S., as represented by the S&P 500 index total return, produced stronger than other investments represented in this chart in this five-year period.

Click image to enlarge
The pandemic, inflation, geopolitical conflicts, political polarization, and artificial intelligence filled the past five years with frightful headlines.
Stock prices doubled in this period.
Stocks rallied modestly in the fourth quarter of 2022 and through the first two quarters of 2023 as inflation cooled and the economy skirted a widely-expected recession.
Stocks turned down in the third quarter of 2023 as 10-year Treasury bond yields surged.
Over the last five years, including dividends, the S&P 500 total return index has gained 107%.
After trading sideways for approximately two years in 2015 and most of 2016 -- and hitting two air pockets -- the stock market broke out of its range after the November 2016 election.
The S&P 500 – a market capitalized weighted index -- rose steadily to an all-time peak on September 20, 2018, whereupon it plunged -20% on fears that the yield curve would soon invert.
On January 4, 2019, the Fed signaled rates were on hold, and stocks rallied for most of 2019.
In February 2020, stocks hit a new all-time peak, when the COVID-19 virus struck and thrust the economy and stock market into meltdown.
No one was old enough to remember the Spanish Influenza of 1918, the last pandemic, making this crisis more frightening than others experienced in recent decades.
Stocks lost more than a third of their value in a matter of about six weeks during the Covid meltdown.
When Congress passed the CARES Act on March 27, the stock market began a recovery.
By early September of 2020, stocks hit a record all-time high.
After a pause, stocks rallied steadily from the November 2020 election through the end of 2020.
Stocks continued upward through the first quarter of 2021 following March enactment of the $1.9 trillion American Rescue Plan Act -- despite the Omicron COVID variant -- through the end of 2021.
The S&P 500 peaked January 3, 2022 and started a decline in the first quarter on worries over Fed tightening and Russia’s invasion of Ukraine.
They continued lower through the second and third quarters of 2022, rallied in the fourth quarter of 2022, and again in the first quarter of 2023.
By June 10, 2023, S&P 500 closed more than 20% higher than its Covid bear-market low in October 2022.
That signaled an end of the 2022 bear market and a new bull market began.

Click image to enlarge
You’d have to go back 105 years to see as tumultuous a time like the post-pandemic period of the last few years to find a comparable post-pandemic time that was as fraught with risk.
The Spanish Influenza struck the U.S. in March 1918 — eight months before World War I ended in November 1918.
The first case of the Spanish flu was recorded in Fort Riley, Kansas.
However, U.S. military censorship prevented domestic newspapers from reporting on the virus afflicting U.S. soldiers in Europe.
When the virus hit Spain, its neutrality in WWI, permitted the U.S. press to report on the virus outbreak in Spain, which is why a pandemic that began in the U.S. is called Spanish Influenza.
We want to stress the importance of history.
Of course, nothing can ever be guaranteed, which is why securities regulators require a reminder on investment related content saying past performance is no guarantee of your future investment results.
Nonetheless, it is wise to look at thee past for guidance, especially when you are living through a period that seems unprecedented.
What you find by looking back over long stretches of time is that almost nothing is unprecedented.

Click image to enlarge
With Stocks Breaking Records And Crises Unfolding, What’s An Investor To Think?
As 2024 began, stock prices were breaking record highs, while Houthi rebel provocations were drawing the U.S. closer to bombing Iran.
North Korea, with tacit approval from China, was threatening to attack South Korea, and the early January consensus forecast of economists in The Wall Street Journal predicted U.S gross domestic product will grow less than 1% in the first quarter of 2024.
What’s an investor to think?
For the answer, let’s turn to history.
History demonstrates that crises are always coming at us.
But the 27 crises noted here came and went.
In modern history, despite considerable setbacks occasionally, stocks averaged a 7% gain annually anyway.
Is that about to change?
Now that would be unprecedented, but it is always possible.
What’s an investor to think?
History shows nothing is unprecedented, giving weight to a continuation of the 7% trendline.
Click image to enlarge

Click image to enlarge
Click image to enlarge
Click image to enlarge
Why Stocks Broke The All-Time Record High
As 2024 started, stocks were breaking record highs.
As they did throughout most of 2023, the economy and stock market kept surprising economists and investors, repeatedly outperforming expectations, and 2024 started out by showing much the same pattern.
Click image to enlarge
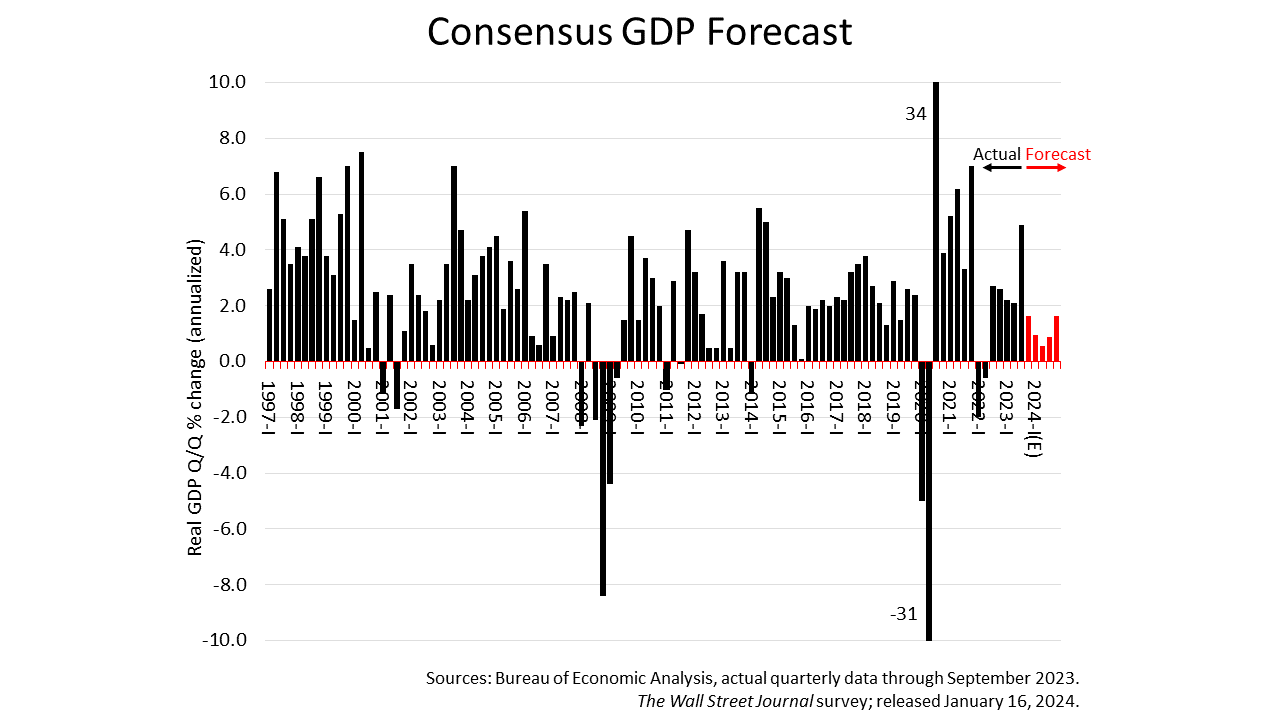
In early January, the 60 economists surveyed quarterly by The Wall Street Journal predicted a slowdown ahead, expecting the fourth quarter 2023 U.S. economic growth rate will come in at 1.65%, slow to 0.94% in the first quarter of 2024, and eke out a 0.55% growth rate in the second quarter before rebounding in the second half of this year.
Despite the tepid consensus forecast by leading economists, the stock market broke a record Friday by closing at a new all-time high price, and algorithmic-driven forecasts by the Federal Reserve Bank branches in Atlanta and New York are again predicting much higher forecasts than the consensus of leading economists.

Click image to enlarge
The GDPNow forecast from the Atlanta Fed, powered by an algorithm that’s updated as new economic data comes in throughout every quarter, was released on Thursday and predicted at 2.4% growth rate in the fourth quarter of 2023. That’s much higher than the consensus forecast in The Journal as well as the Blue Chip Financial Forecasts survey of economists. In addition, the New York Fed’s Nowcast, which is based on an algorithm its staff developed independently, on Friday was also forecasting a 2.4% growth rate for the final quarter of 2023.
Since the pandemic struck the U.S. in early 2020, the Federal Reserve branch algorithmic-powered forecasts have been far more accurate in predicting the growth rate of the economy.
Economic growth drives corporate profits and profits drive stock prices. Investors are seeing the economy continue to outperform expectations. That’s why stock indexes broke the high set two years ago.
