


Contact Us Today!

Market Data Bank
Click image to enlarge
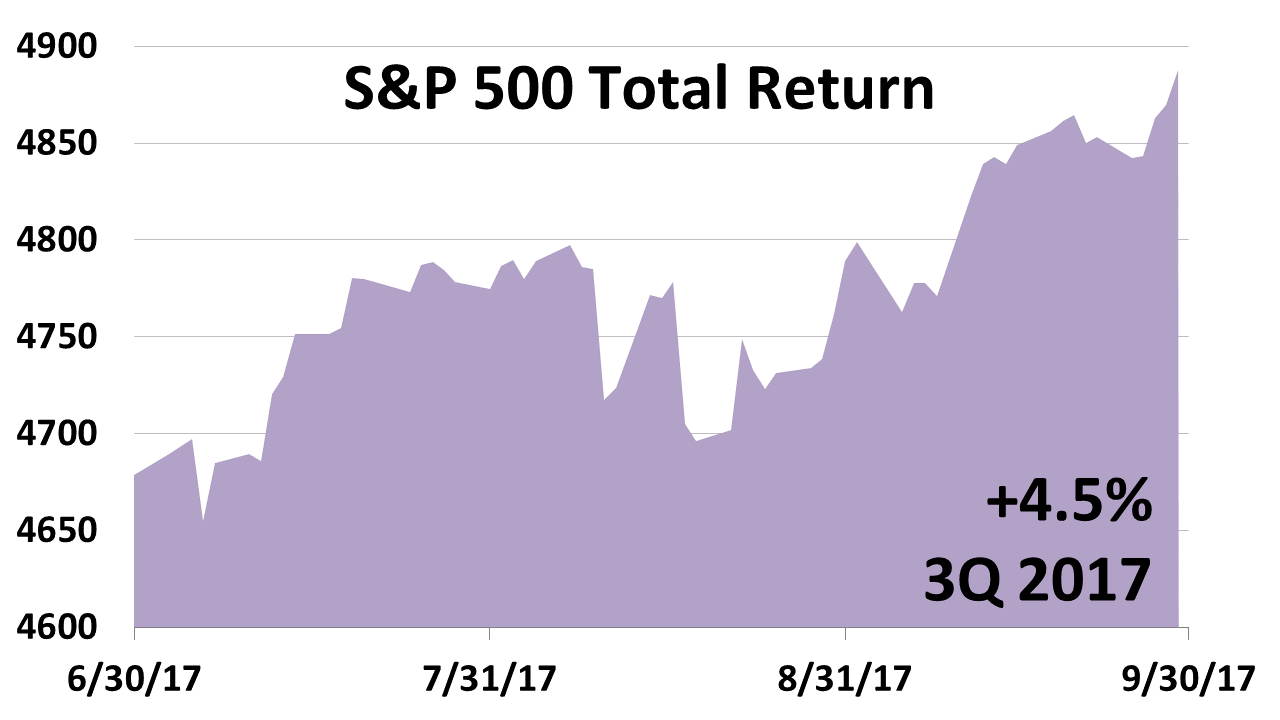
ECONOMY AND STOCKS STRONG
The S&P 500, a key to growth of capital in broadly diversified portfolios for the long run, posted a 4.5% return in 3Q2017, following a return of 3.1% in 2Q2017 and 6.1% in 1Q2017. Total return on the S&P 500 since 1926 has averaged about 10%, making the 9.3% return in the first half of 2017 an exceptionally strong start to the year.
Click image to enlarge
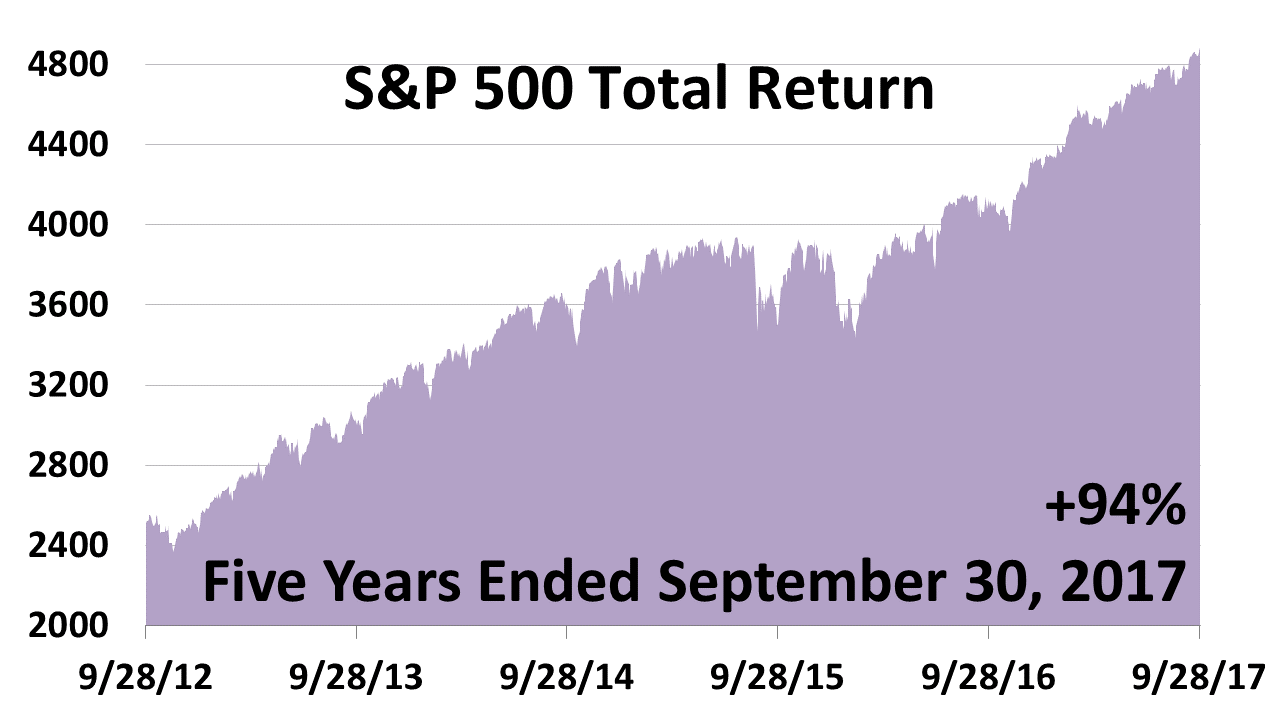
STOCKS NEARLY DOUBLED OVER FIVE YEARS
As this long bull market grows older, the likelihood of a bear-market drop of at least 20% increases. But fundamental economic conditions accompanying bear markets in the past are not present now. Fed policy is not restrictive, GDP growth isn’t slowing, and stock investors are not acting irrationally exuberant.
Click image to enlarge
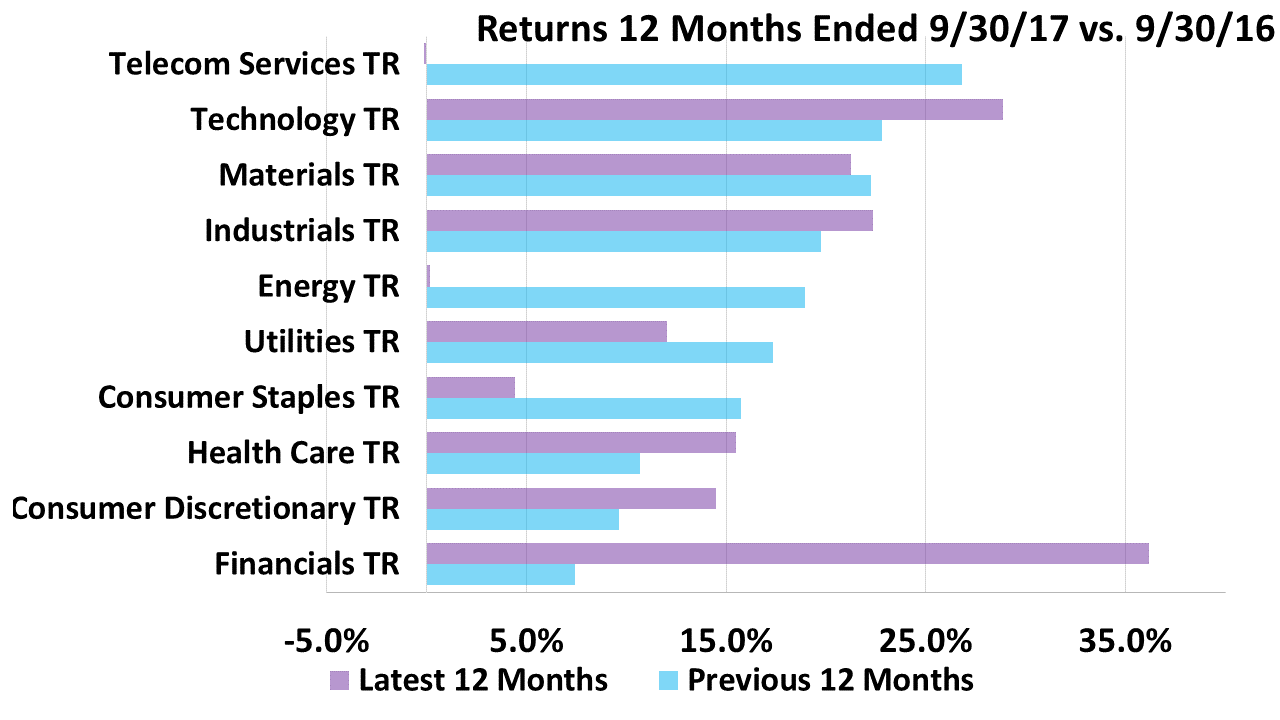
ABOUT-FACE IN FINANCIALS AND TELECOM
For the 12 months ended Sept. 30, 2017, telecom shares went from darlings to dogs. The last 12 months were an about-face from the prior 12 months. Rebalancing is a statistical approach to managing the risk inherent in sector rotation.

Click image to enlarge
INDEXES TRACKING 13 ASSET CLASSES
A 68.4% loss in the index tracking crude oil’s price in the five years ended Sept. 30, 2017 shows the risk of investing too much in one industry, asset class or style. Among this broad array of 13 asset classes, U.S. stocks came out way ahead in the five years. In recent months, however, foreign stocks outdid U.S stock indexes.

Click image to enlarge
APPROACHING THE LONGEST BOOM
This expansion, which began in March of 2009, is approaching the age of the second-longest boom in modern U.S. history. Unexpected bad news could derail economic growth forecasts at anytime, but this expansion could otherwise yet rival the 120-month boom of the 1990s, the longest post-World War II.

Click image to enlarge
S&P 500 INDEX VS. EARNINGS¥
Estimated 2017 earnings on an average share in the S&P 500, as of October 2, was $131.12 and $145.45 for 2018. Stocks are not valued outlandishly. In early October, the consensus forecast was for 2.5% growth in the five quarters through September 30, 2018, a big jump in GDP growth, which would be good for stocks.
Past performance of investments is not a very reliable indicator of future performance. ± Indices and ETFs representing asset classes are unmanaged and not recommendations for any specific investment. Foreign investing involves currency and political risk and foreign-country instability. Bonds offer a fixed rate of return while stocks fluctuate. Leading economic indicators from the Conference Board. S&P 500 bottom-up operating earnings per share for 2016 (actual), 2017 (estimated) and 2018 (estimated) as of July 9, 2017: for 2017, $131.12; for 2018, $145.45. Sources: Yardeni Research, Inc. and Thomson Reuters I/B/E/S survey of consensus estimates. Standard and Poor’s for index price data through October 4, 2017; and actual operating earnings data through 2016.
